Interfacing rule-based feature recognition with machine learning (AI) methods
Hey, why does your Python code look pretty much like C?
The papers by Jayaraman et al. [1] and Lambourne et al. [2] represent profound studies on AI-based feature recognition. Their research is backed by Autodesk, and that makes me think they were not just playing scientific games but rather trying to step into the field with something meaningful. The cornerstone problem they are attacking is how to turn B-rep data structure describing a CAD part into something acceptable by an AI network. Back in the day, we worked on a somewhat similar subject: we turned B-rep models into adaptive point clouds, and this is how the corresponding functionality got integrated into Analysis Situs.
 |
While point clouds are commonly accepted as a sensible shape descriptor, it still looks more appealing to reuse the topology of a CAD model as much as possible. The intention is quite clear: by having a shape descriptor that accommodates the faces of a model, we get a more factorized output that can be mapped back to CAD features.
Another fresh piece of research related to AI in feature recognition has been recently published in CAGD by S. Zhang et al. [4] They build their framework on top of UV-Net [1] and effectively employ the same FAG and sampling approaches.
In this post, I'll share some instructions on how to get started with the part of Autodesk's AI ecosystem that is pure geometric. That's an absolute beginner's guide for a quick start with the Python OpenCascade wrapper and an overview of the new functionality injected by Autodesk AI Labs for the machine learning community in CAD. Autodesk used OpenCascade for broader dissemination of their published work.
Yet another wrapper: occwl
OCCWL is a "simple, lightweight Pythonic wrapper around pythonocc (python bindings for OpenCascade)" [3]. The Autodesk team needed to switch from initial B-rep to formal graphs in order to obtain a DGL-based input for a neural network. The graph they construct is pretty much the same AAG as we have in Analysis Situs, with some differences:
- The graph is kept oriented.
- The arcs in the graph correspond to all coedges between faces, and therefore the data structure is more verbose than the one that we use.
While it is interesting to try out the recognition engine as such, I don't feel competent enough to draw any conclusions based on my experiments with AI, so you'd better go and try it yourself. What I rather found interesting is this occwl wrapper as such, because it not only wraps OpenCascade for another language but also adds something new to the kernel. Let's see how to get it deployed.
- As with PythonOCC, it makes sense to perform installation through Anaconda. Go to the official website (github.com/AutodeskAILab/occwl) to follow their instruction. In the Anaconda prompt, perform the following commands:
conda create --name=myoccwlenv python=3.7
conda activate myoccwlenv
conda install -c lambouj -c conda-forge occwl
If conda install -c lambouj -c conda-forge occwl freezes, use the "mamba" approach as proposed by Autodesk AI:
mamba install occwl -c lambouj -c conda-forge

To install mamba, execute conda install -n base -c conda-forge mamba in the Anaconda prompt (launched with admin privileges).
- The installed environment shows up in the Anaconda Navigator. I'm not sure if Python people use this (quite heavy) UI tool, but in what follows, I'll be using it to run Visual Code.

To be able to debug from Visual Code, run VS Code from Anaconda Navigator:

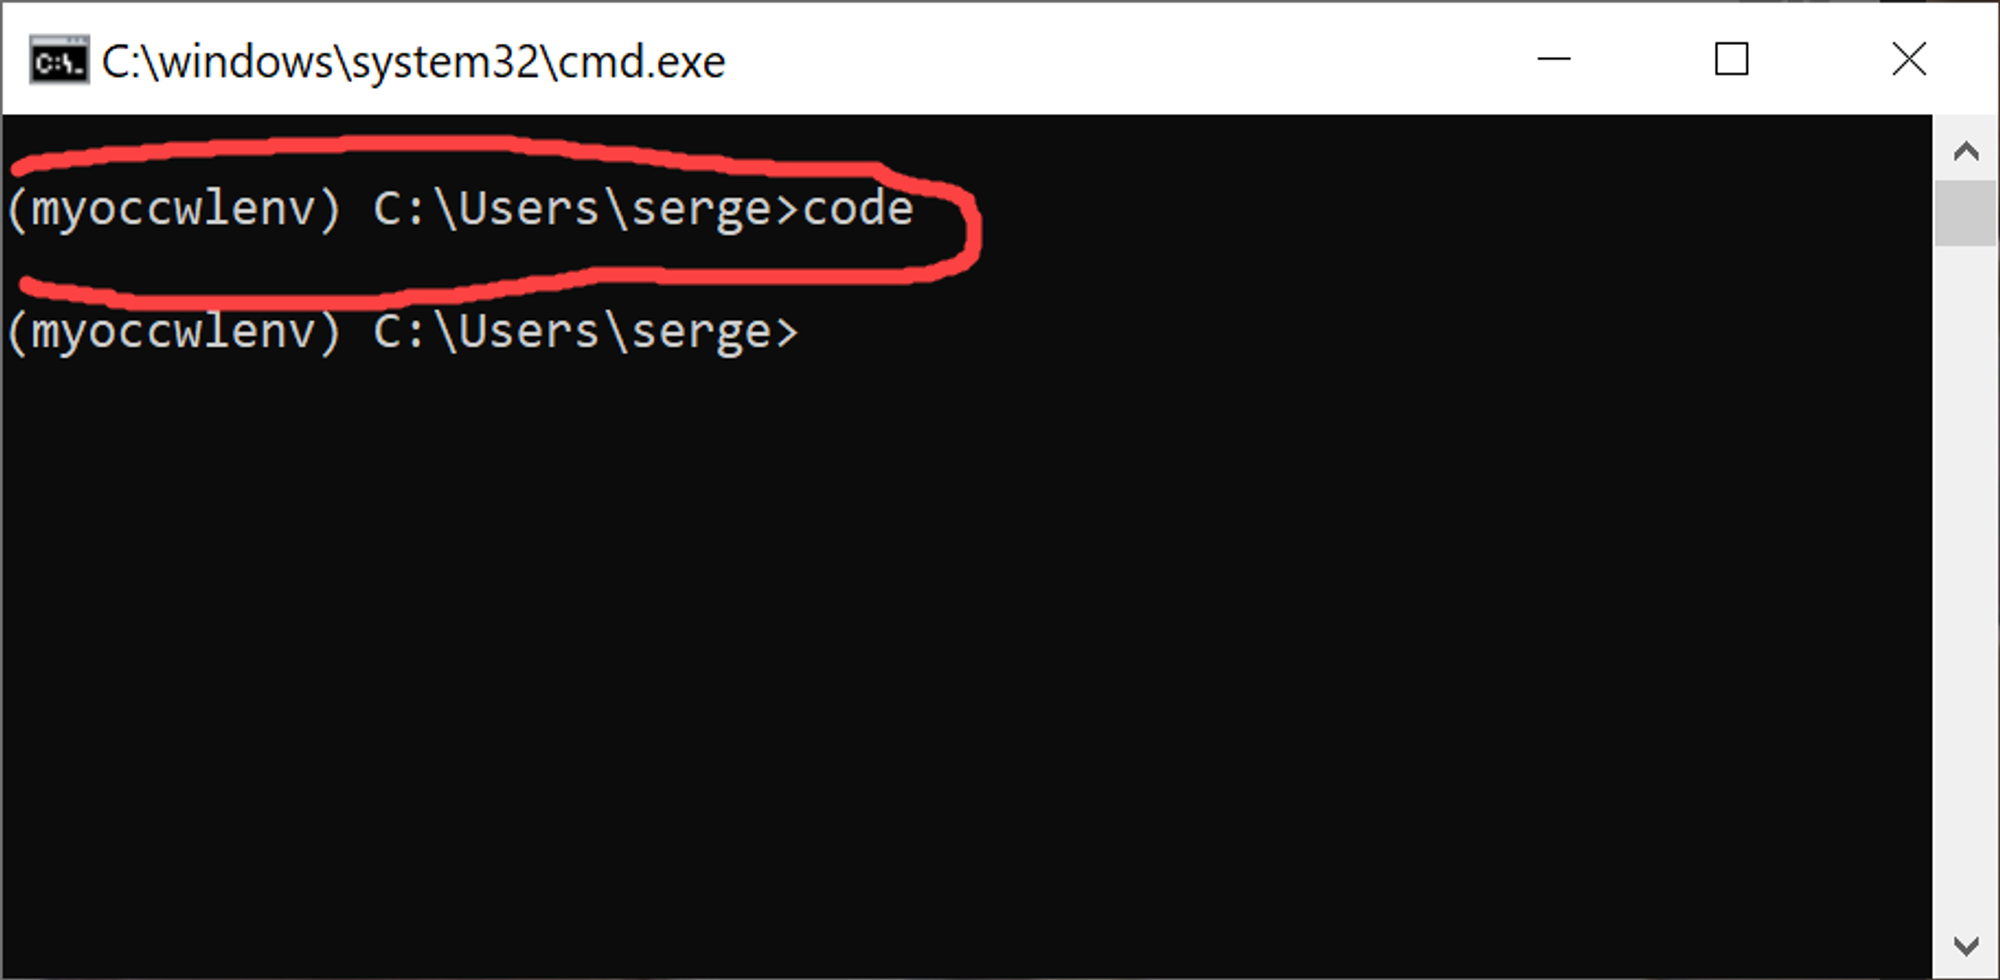
You can also cd into your working directory and run code . to open up VS Code for the current folder.
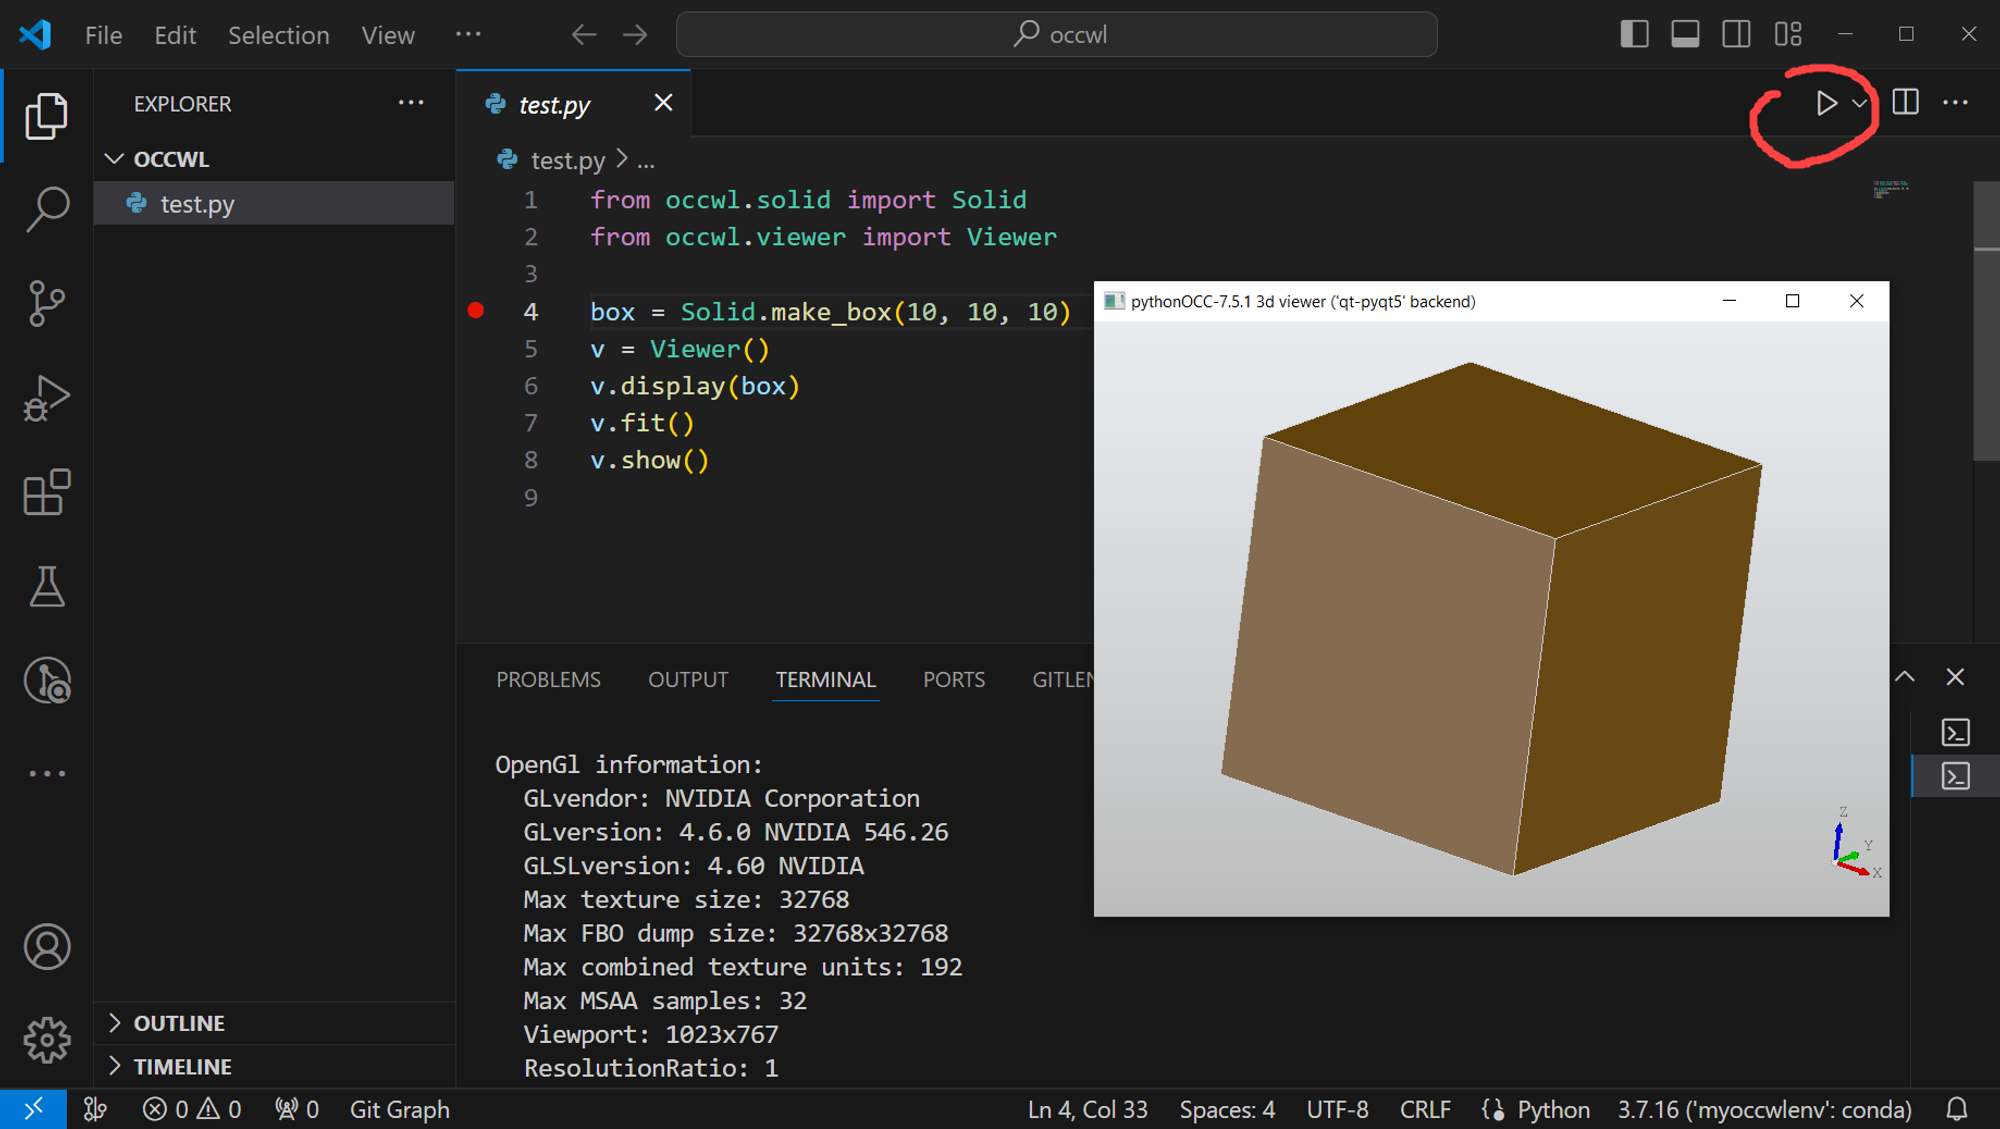
- Run the test script to check that occwl is functioning:
from occwl.solid import Solid
from occwl.viewer import Viewer

box = Solid.make_box(10, 10, 10)
v = Viewer()
v.display(box)
v.fit()
v.show()
To fix the OCC display error, apply the patch:

You should be able to run and debug this script from VS Code since it was launched with the inherited environment for occwl:
Graphs
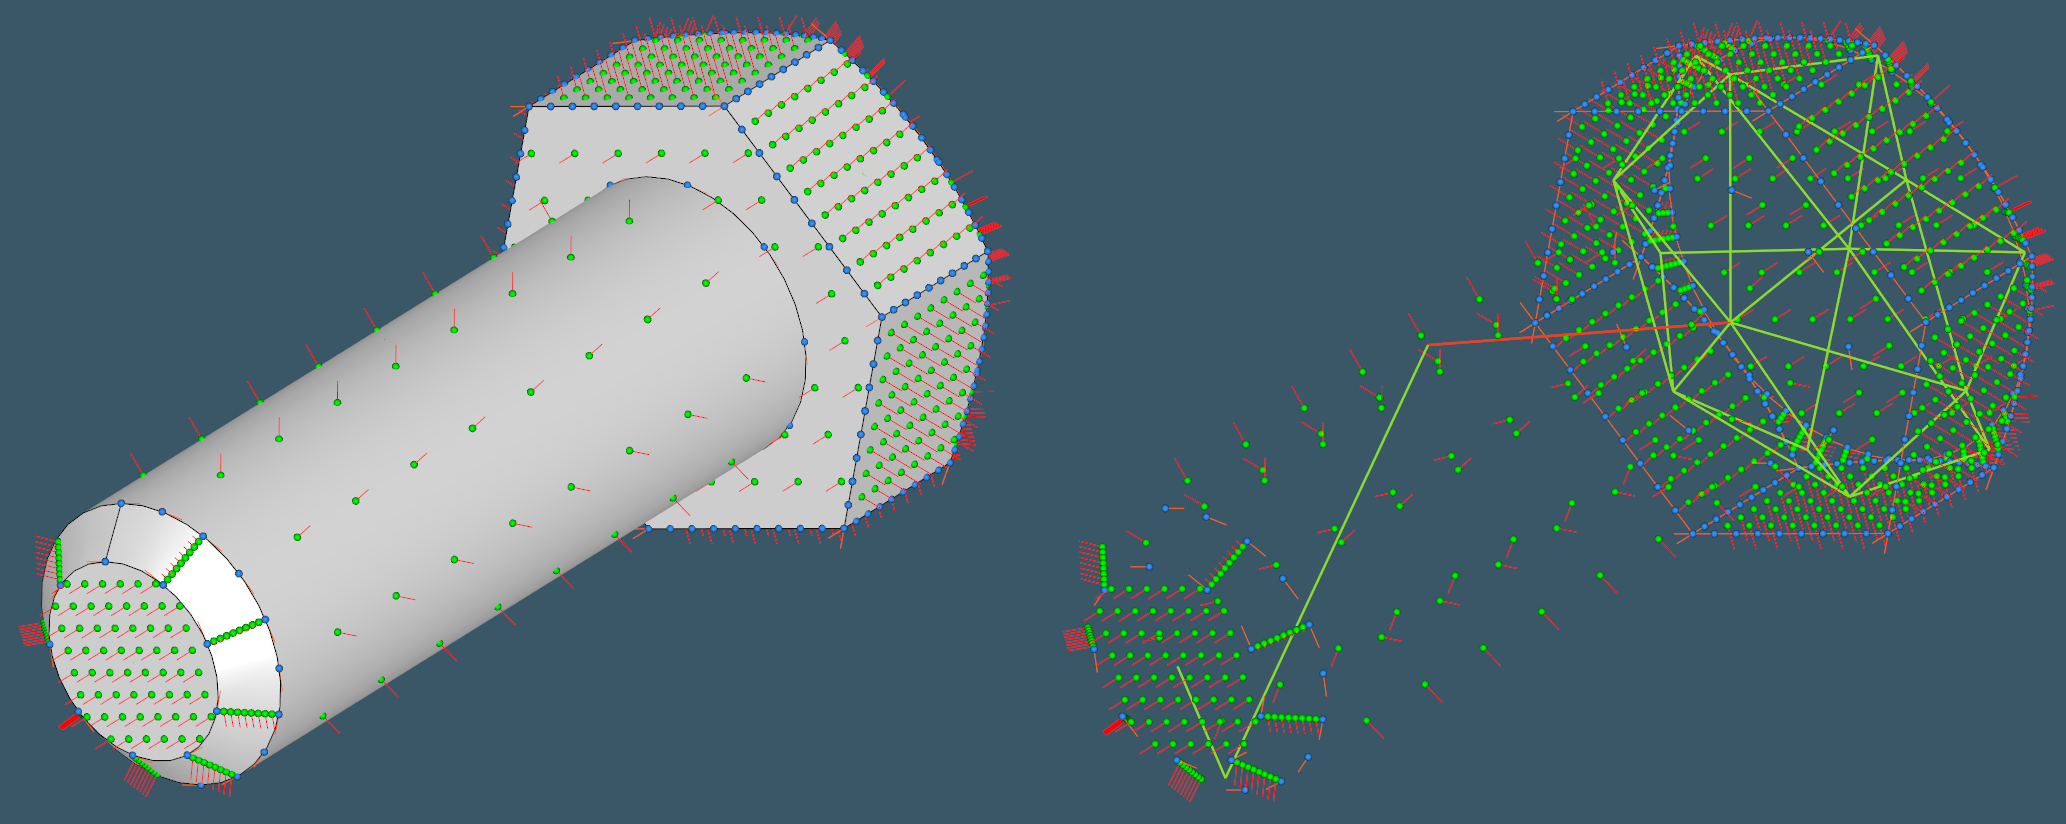
The occwl package includes a few examples that you may run to test the new features. Since the primary goal of this research was to apply a graph-based machine learning technique, one of occwl's significant contributions appears to be the adjacency graph. It can be visualized in a funny way:
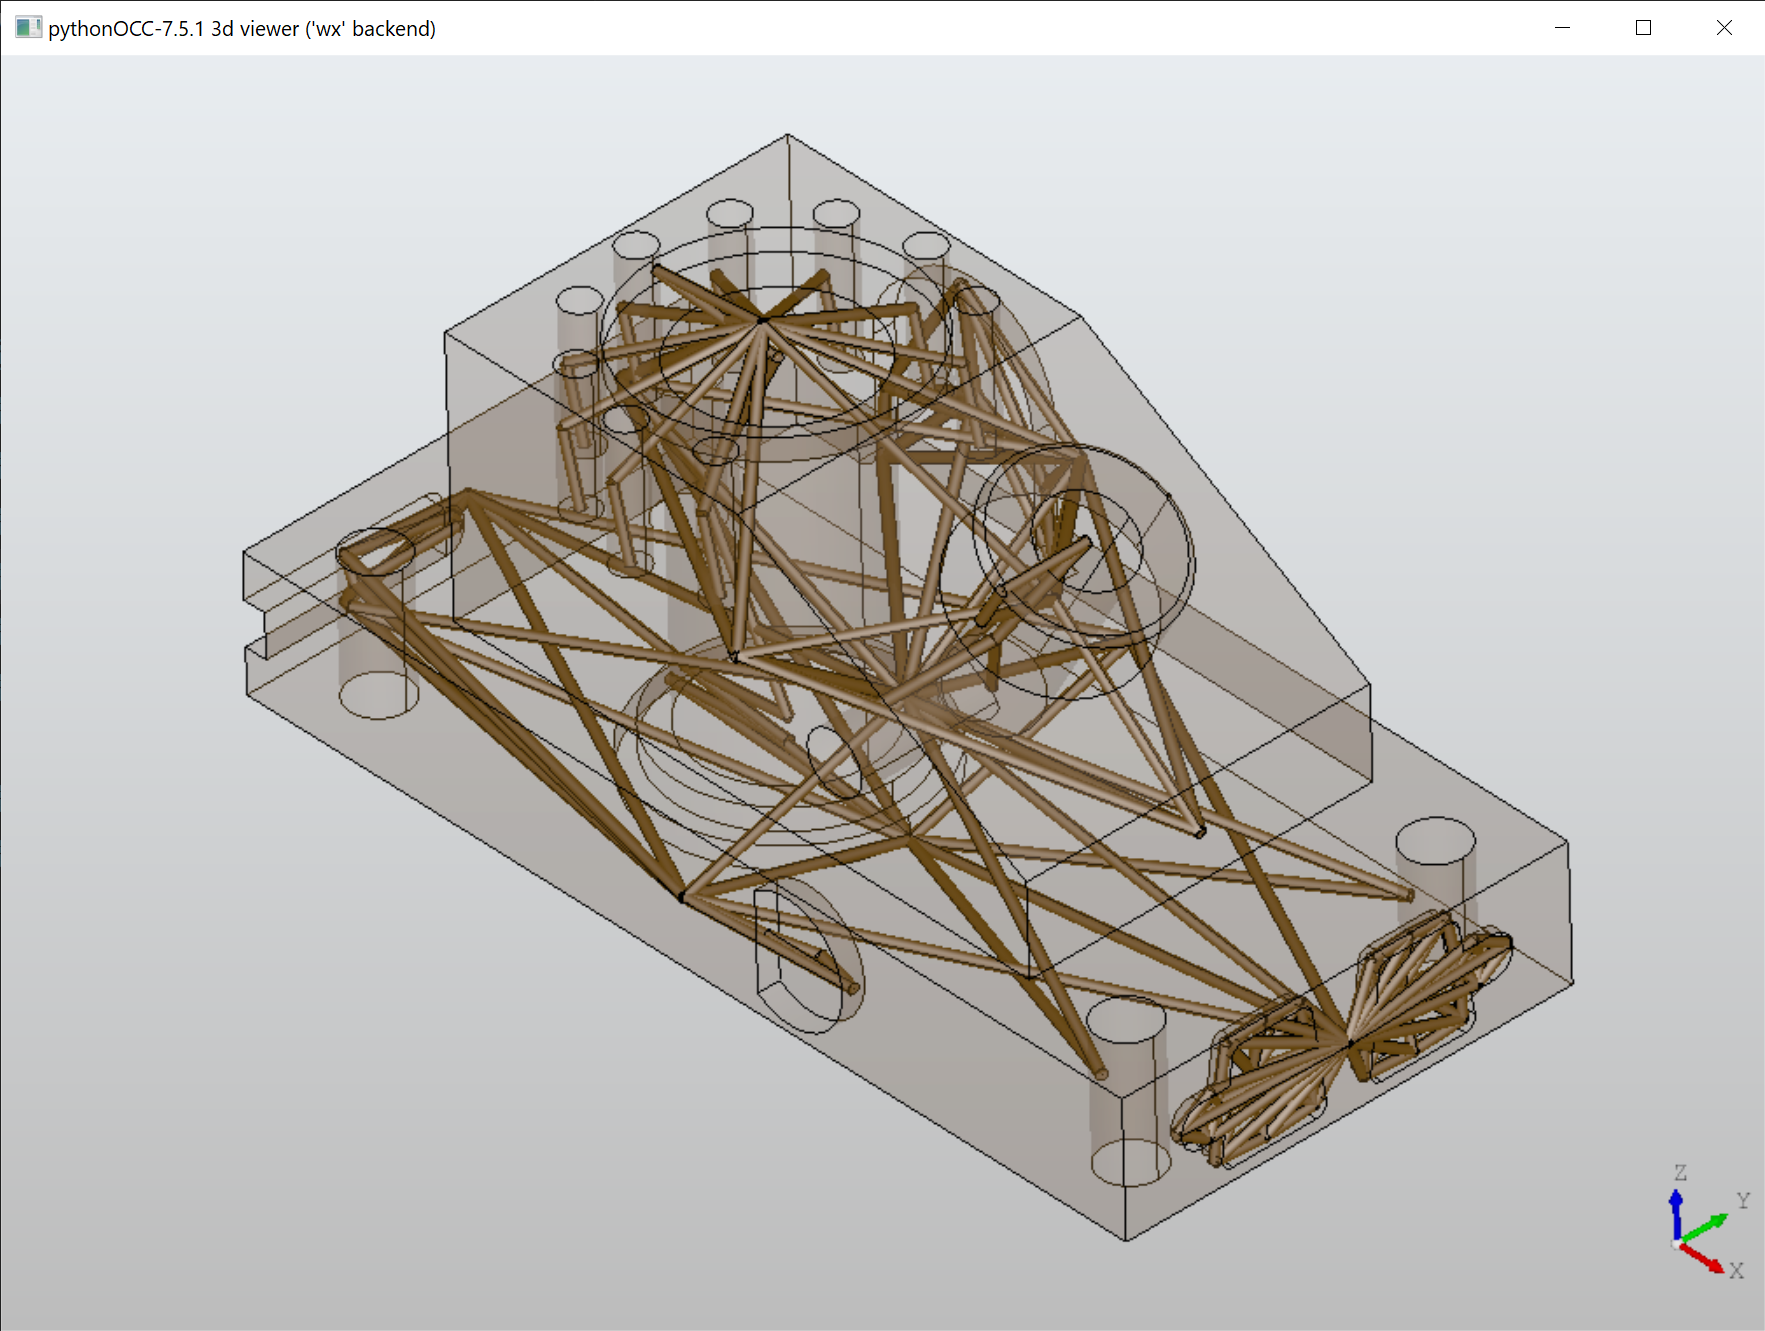 |
Inspired by occwl, we introduced the same technique in Analysis Situs (#317). However, although it looks fancy, this approach is pretty useless in practice as it does not allow you to clearly see neither the graph nor its connected components.
 |
Still, the graph structure is there, and it's aimed at being converted to a DGL graph for the sake of input unification. The attributes of this graph are the sampled points and their corresponding normal fields.
 |
Sampling of face and edge parametric domains is another feature of the occwl library. Let's have a more in-depth look into it.
Grids
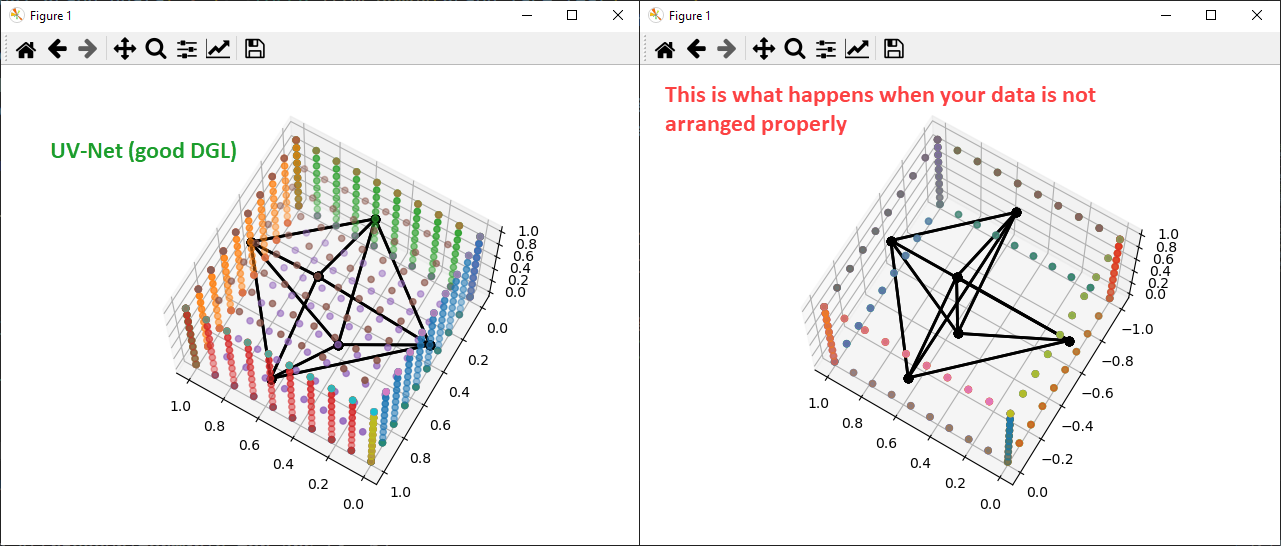
The sampling approach by Jayaraman et al. [1] allows us to turn a CAD model into a point cloud, just like we did it in Analysis Situs back in the day. The significant difference between our approach and the UV-Net's one is that their point cloud is structured because it's arranged by the nodes of an adjacency graph. In a way, it's a point cloud with topology. Let's see how to build the same thing in Analysis Situs.
The face sampling algorithm is implemented in the asiAlgo_SampleFace class of Analysis Situs. It comes along with three evaluation methods for the point membership classification of a point on a surface:
- Precise classifier (OpenCascade's native).
- Discrete algorithm by Haines (by Eric Haines, see ptinpoly).
- Discrete row-based algorithm (implemented in Analysis Situs).
Face sampling is a pretty basic computation, as it finds its use in a variety of algorithms. For example, we sample probe points in the REPATCH operator for constraining the reapproximated surface. Another use of face sampling is the recognition of convex-hull faces. To run the algorithm for face sampling, use the following command:
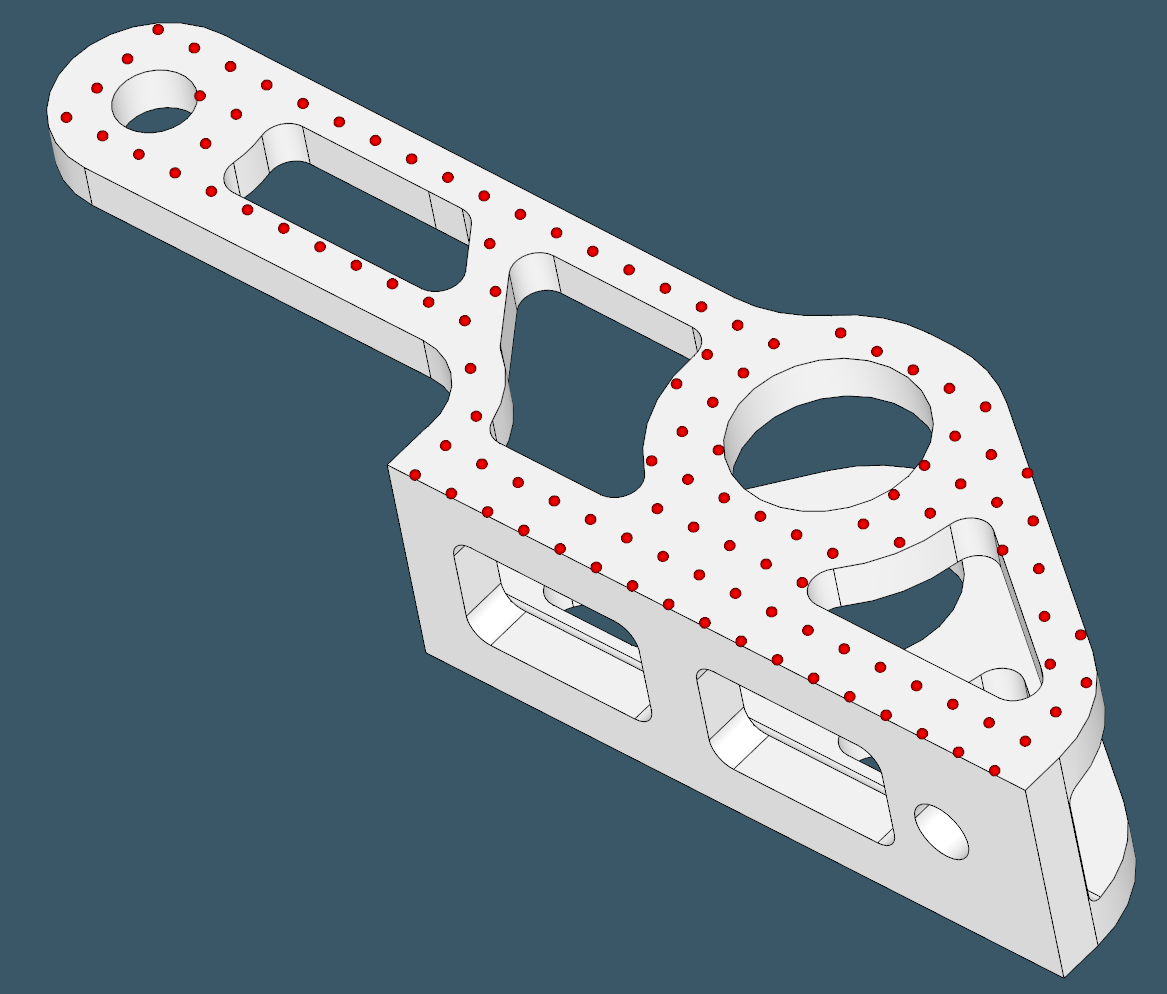
Here's an example of a face sampled by overlaying a regular grid:
 |
One important discovery from bridging Analysis Situs and DGL was that our AAG did not support user-defined attributes in graph arcs. This limitation restricted us from attaching discretization points to CAD edges, while this information was essential to pass to a neural network (#318). With the recent improvements, it is now possible to attach custom attributes to the graph links in the same way it works for nodes. For that, we introduced another internal collection in the AAG, which looks like this:
class t_arc_attr_set : public t_attr_set
{
public:

  t_arc_attr_set() {} //!< Default ctor.

  //! Constructor accepting a single attribute to populate the internal set or
  //! initialize a separate member field in the case when the passed attribute
  //! corresponds to the dihedral angle.
  //! param[in] A the attribute to populate the set with.
  asiAlgo_EXPORT
    t_arc_attr_set(const Handle(asiAlgo_FeatureAttr)& A);

public:

  Handle(asiAlgo_FeatureAttr) AngleAttr;
};
This is not a straightforward map of GUID-to-Attribute, but a more specialized type to aggregate the dihedral angle attribute AngleAttr for fast access (without using hash functions). This little trick allows us to keep decent performance of AAG in computationally intensive workflows.
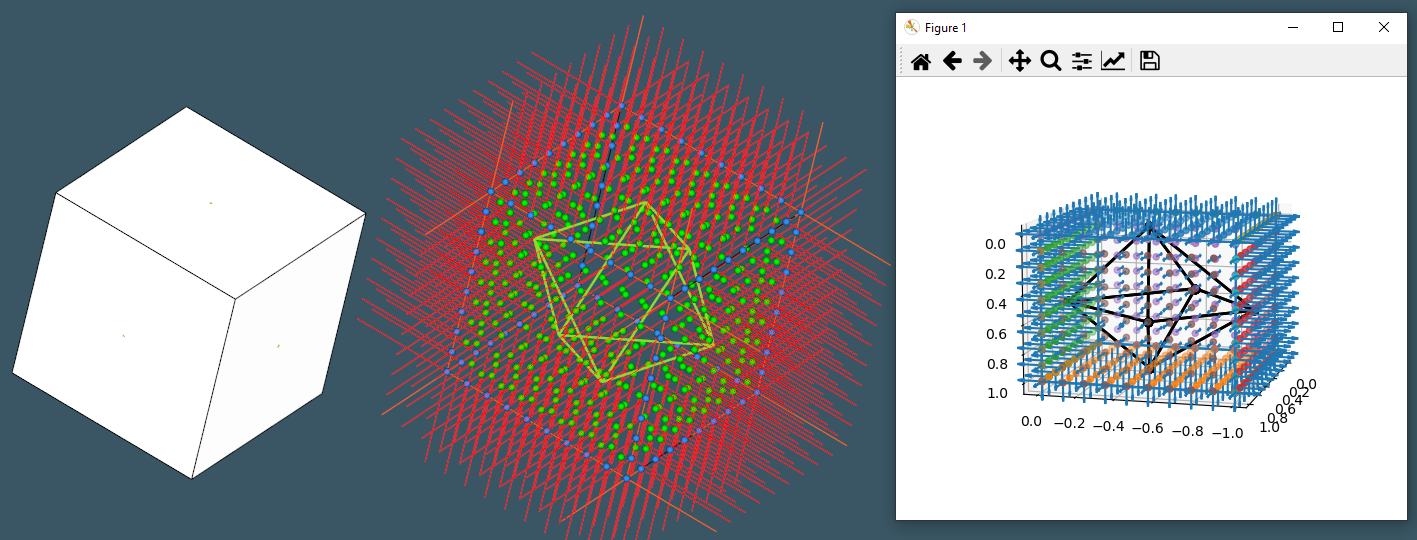
Now look at the following picture: the constructed face and edge grids overlay the familiar shaded B-rep and maintained attached to the adjacency graph as its attributes. This is exactly the data we need for deep learning with UV-Net.
 |
Passing data to DGL
Once the AAG structure has been built and augmented with specific attributes, it must be transferred to the Python ecosystem for further use in machine learning methods. The good news is that DGL is written in C++, which allows us, in theory, to integrate it with Analysis Situs.
 |
In particular, we were looking for a way to build a DGL graph in C++ and serialize it to the DGL's native format so that it can be restored quickly in the Python environment later on.
 |
If Analysis Situs is linked against DGL (either dynamically or statically), then we can theoretically use DGL's serialization functions.
 |
The problem with this approach is manifold:
- The bad news is that DGL is mostly designed for being used in Python, and therefore you won't find any C++ API documentation for the library. The information on the users' forums is sparse and not very helpful when it comes down to C++. It seems like DGL aims at providing a stable Python API, while in its C++ engine room, things are way trickier and more volatile.
- There are some pure infrastructural problems, such as DGL does not necessarily compile on Windows or does not export all required functions (due to missing __declspec qualifiers). Also, not all header files are installed, so be ready to collect them manually. These issues can be solved either by modifying the DGL's codebase or by compiling it as a static library and integrating it into Analysis Situs as its integral part.
- Having all the configuration done, it's hard to use lower-level functions for serialization and deserialization because both the format and the serializers largely remain black boxes. Here is a typical kind of situation I've found myself in after several hours of struggling with the library:
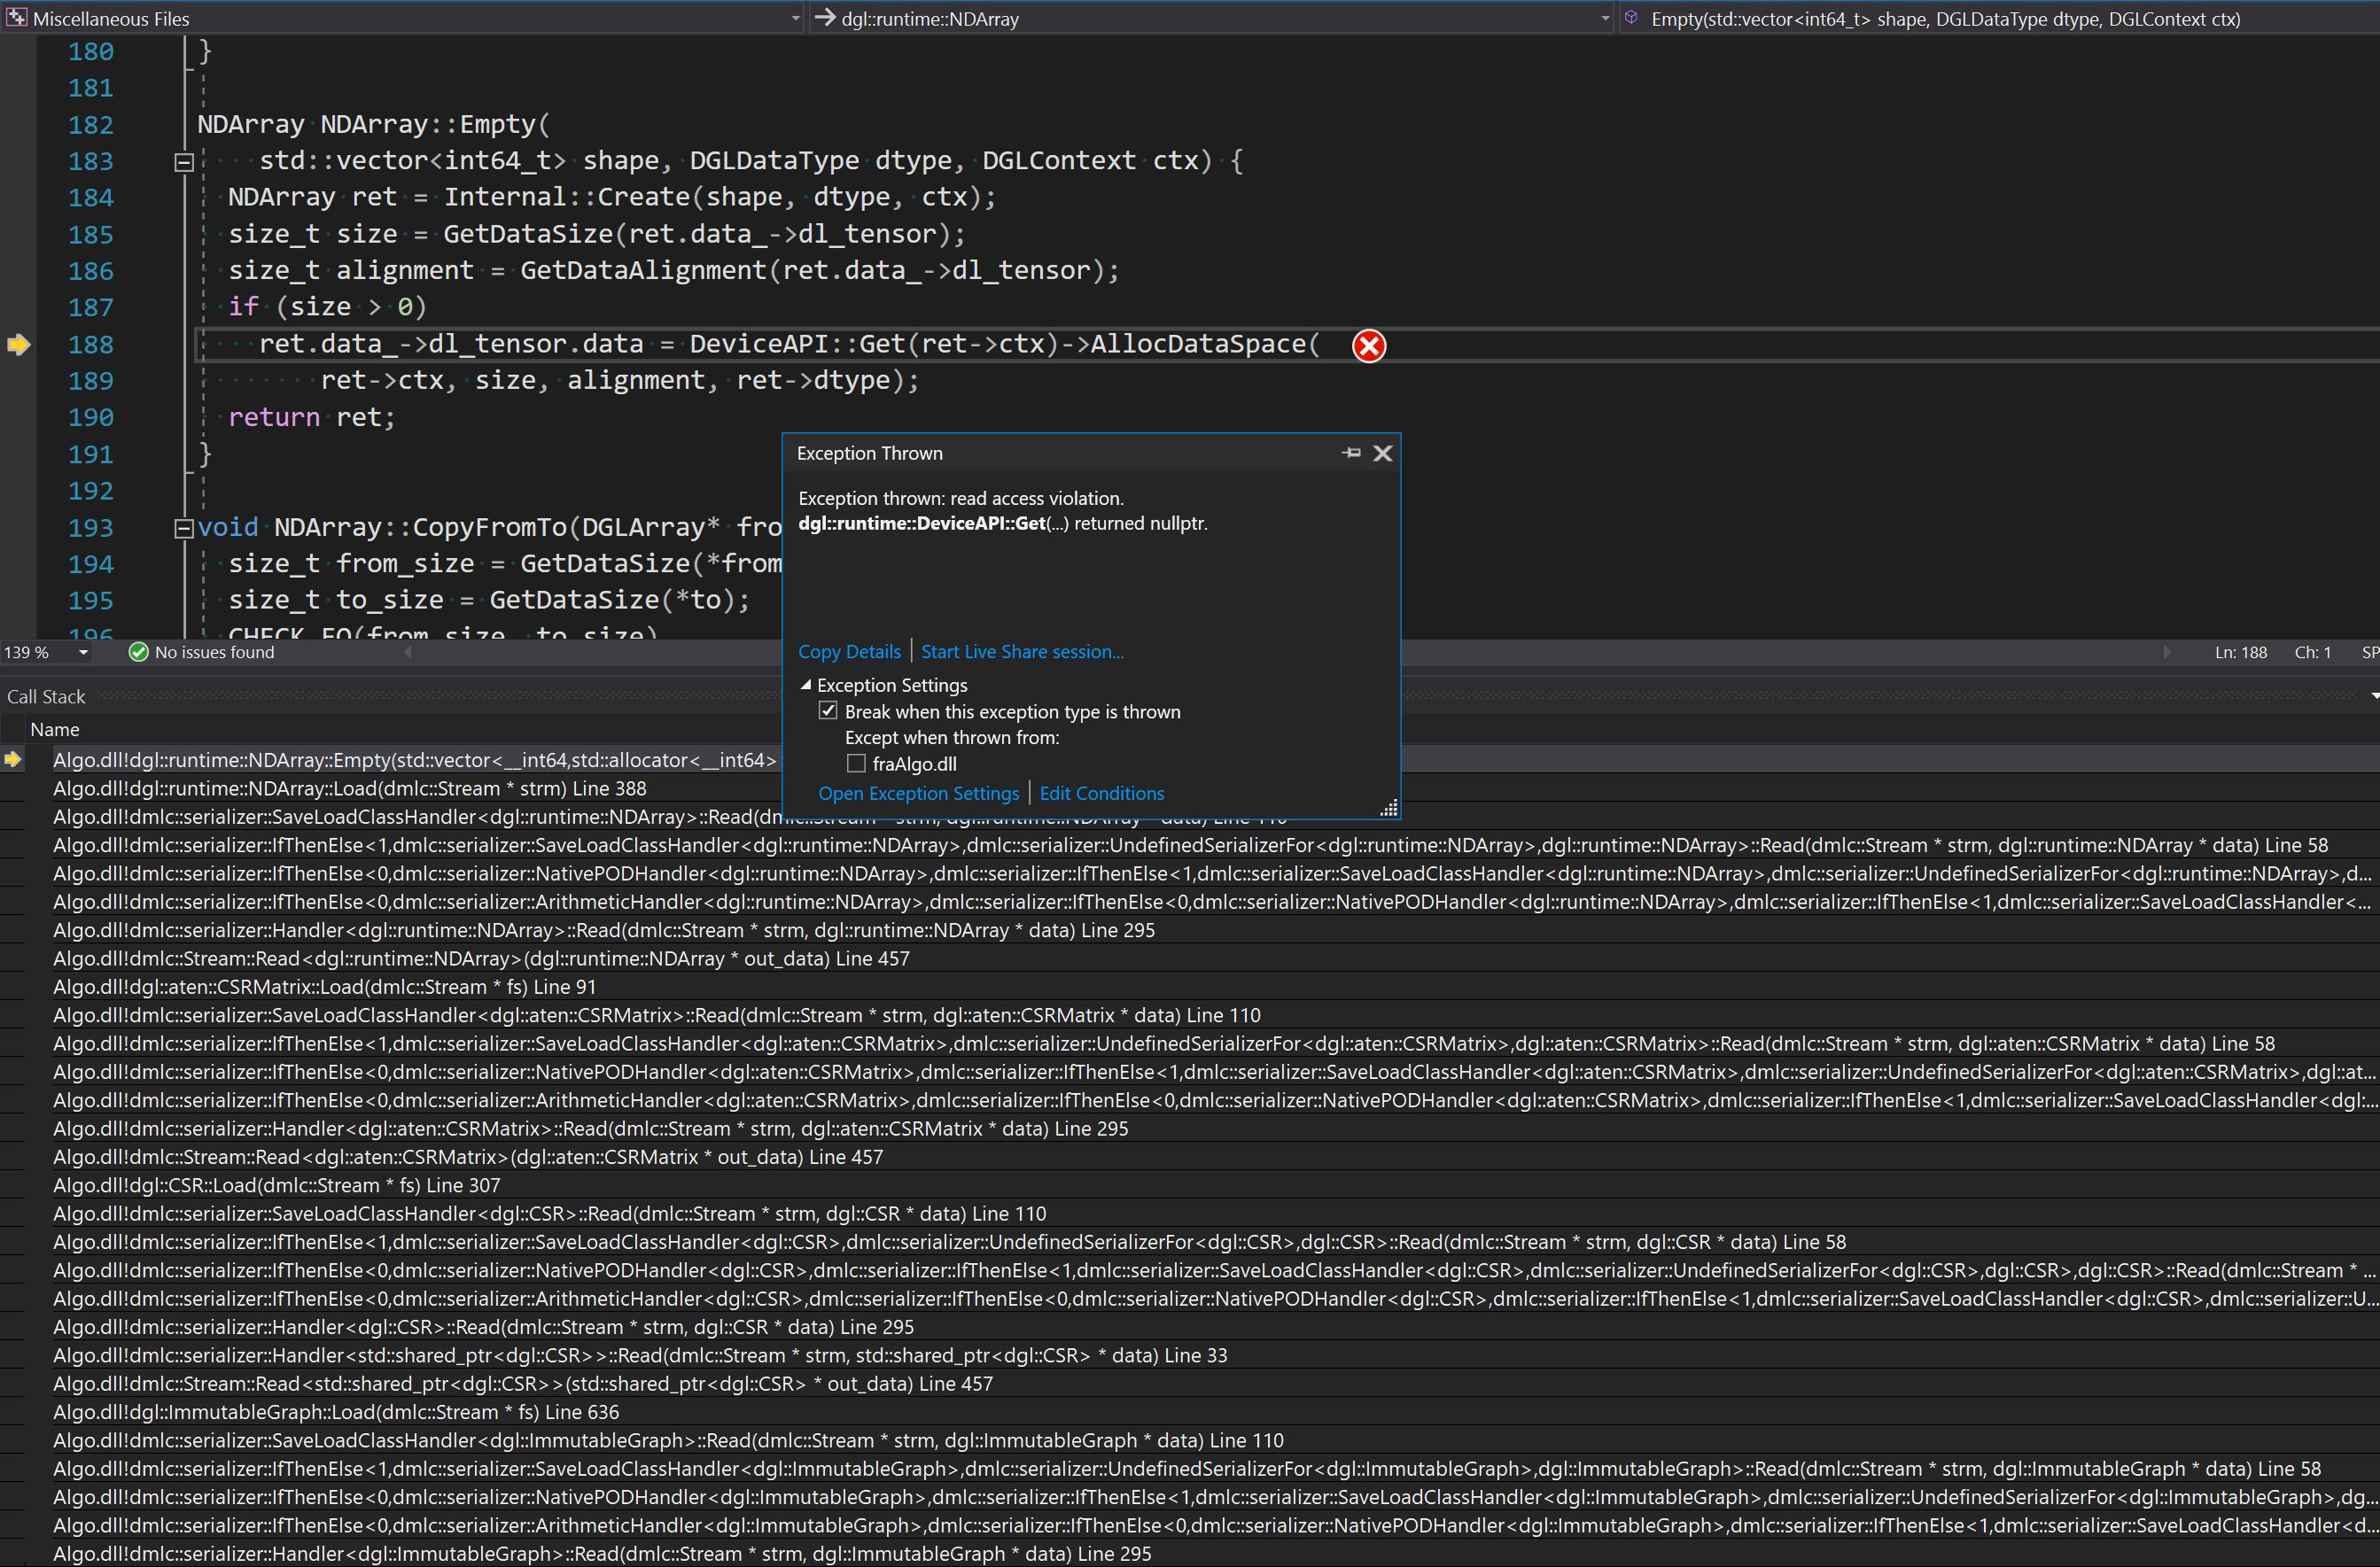
Just look at the stack trace for this crash (here Algo.dll is my custom library, which I linked against DGL statically). You can call me a C++ noob, but I am confident that I will never get out of such a deep stack trace, nor will I comprehend all of these infinite templates here and there. If the code does not resemble a "warm lamp" Pascal-style begin-end structure, I quickly become miserable.
So, instead of introducing yet another dependency, which is very hard to tackle (like maintaining a Siemens' turbine in your garage), let's put it another way around. The idea consists in the following:
- Analysis Situs serializes the AAG in its own plain and simple binary format.
- The Python endpoint is supplied with a Python-written reader of this custom format.
- The DGL graph is constructed only at the Python endpoint when the graph with all its associated arrays (they call them "tensors") is deserialized from the binary file.
 |
The binary format remains under our exclusive responsibility, so we can be sure that the data is consistently serialized and deserialized without any loss (#320). Also, no extra dependencies are introduced, which is always a good thing. All of the DGL's dark magic remains where it belongs and where it shines brighter: at the Python endpoint.
Experiments
To diagnose data translation problems, we used matplotlib and the specialized functions provided by UV-Net for rendering the graph and the sampled points all together.
 |
The following picture illustrates how an initial B-rep model turns into a DGL-based descriptor accepted by a neural network.
 |
With such a descriptor, you can (in theory) forget about B-rep and use conventional graph-based learning models for AI.
References
- Jayaraman, P. K., Willis, K. D. D., Lambourne, J. G., Morris, N., & Davies, T. (n.d.). UV-Net: Learning from Boundary Representations. (full text).
- Lambourne, J. G., Willis, K. D. D., & Meltzer, P. (n.d.). BRepNet : A topological message passing system for solid models (full text).
- OCC Wrapper Library on GitHub. Accessed 2024-04-22 (link).
- Zhang, S., Guan, Z., Jiang, H., Wang, X., & Tan, P. (2024). BrepMFR : Enhancing machining feature recognition in B-rep models through deep learning and domain adaptation. Computer Aided Geometric Design, 111 (April), 102318. https://doi.org/10.1016/j.cagd.2024.102318 (full text)
Want to discuss this? Jump in to our forum.