These memory leaks
There are at least two metrics you normally wanna control in your software: how fast it is and how much memory it consumes. We usually start with the performance issues as they are easy to spot: lack of performance rarely remains invisible. You know when it's lagging, right? A bit different situation is, however, with memory. Memory problems could largely remain unnoticed because of different factors: you don't have real long runs of your app; you don't run it in the memory-restricted environment (such as Docker); or for whatever else reason you have never had looked into your Task Manager or kinda.
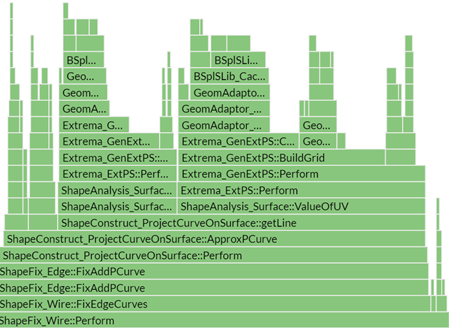
But let's drive it right into the dirty practice. If you have ever struggled with the performance and leaking heap issues, you would normally have your own means to attack those problems. There are also some decent tools like the VTune Profiler from Intel doing excellent job in visualizing the detected hotspots. Look at this flame graph for example. I got in love with it the first time Julia showed me that thing:
 |
Flame chart in VTune Profiler. |
Hotspots are easy to detect. As for memory problems, they tend to burn significantly more brain cells. I cannot think of any handy tool that would clearly pick on a place in your code that looks suspicious about memory problems. The difficulty here is that, unlike in the performance analysis, the analysis of memory is full of false positives. That is because the life spans of dynamically allocated objects do not necessarily match the snapshot window you've chosen for tracking the memory difference. Imagine that your algorithm allocates a somewhat new shape that is later on passed to a result data structure and persists till the end of the application run. The very fact of this dynamic memory allocation could easily be confused with a heap leak, although it's completely normal and is totally under control.
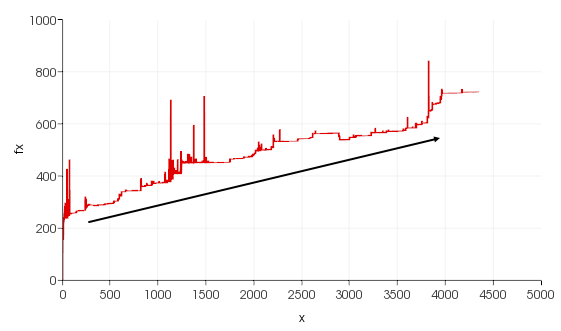
To survive memory analysis, you need to come up with a strategy. Putting together a memory consumption chart looks like a reasonable start. Although fancy profilers like the one embedded in Visual Studio can do that job, I'm not a big fan of blind sampling and generally prefer manual measures. We discussed one straightforward approach back in the days, and I still find it useful over time. It's stupid and simple: you collect all memory measures to a static tracker by sampling your process memory in all suspicious places across your code base.
 |
Process memory consumption chart. You would expect having a horizontal trend line to avoid going out of memory in the long run. |
Having access to sources and being able to recompile is essential here. You then need to spread some magic macro across your code, something like this:
for ( ... )
{
  MEMCHECK

  // Your code to profile goes right here.

  MEMCHECKREL // or yet another MEMCHECK for absolute measures.
}

// Dump to file.
MEMCHECK_DUMP("memlog.txt")
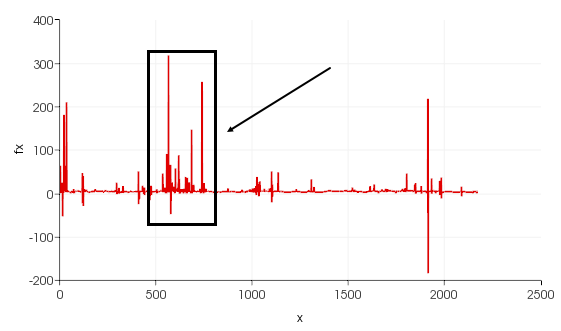
The overall memory chart says nothing about potentially leaking pieces of your code. To get a more focused look, you can measure delta by snapshotting memory before and after a specific code block. Having plain zero level of this delta diagram would mean that the code releases all the memory it allocates.
 |
Process memory delta chart. You would not expect having all these peaks, or at least to have them followed by anti-peaks. That's not what is happening here, in the highlighted window. |
Of course, we might come across false positives, and that's exactly why you need to clearly understand what's going on in the code to profile wisely. The tedious part is to exclude all memory allocations that are presumably fine and move your focus recursively to uncertain code blocks. That's no fun at all.
Lessons learned
Smart pointers
Make sure your pointers are smart enough. In our team, we are using a mix of OpenCascade plus VTK, where both libraries come up with their own implementations of smart pointers. VTK is arguably doing that surprisingly badly, as the methods you call from it often return naked pointers. It's up to you to decide whether to take the ownership of those pointers or not. And then keep fingers crossed that your memory is gonna get cleaned up later on. Take care of using smart pointers whenever you can.
In OpenCascade, as a rule, you can always use smart pointers and never care about who is taking the ownership of your object. The ownership is not a thing at all then. Your object is just shared across different consumers, and you know it's not leaking because the pointers are never naked on your side (there are some exceptions from that, e.g., circular deps, but let's leave them for now).
Oh-CAF
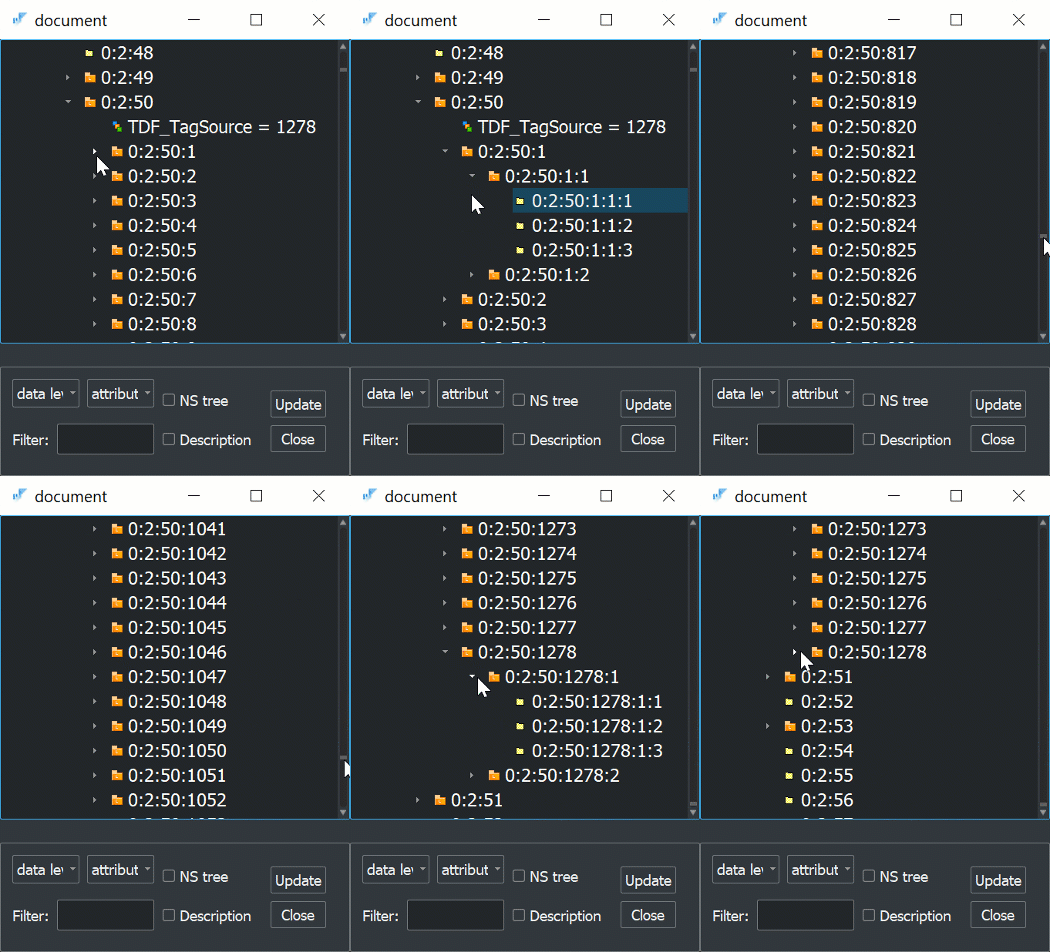
Everybody knows that smart pointers are nice and using them improves your karma. Much fewer people know about a few specific aspects of the OpenCascade library that could potentially cause memory leaks. OCAF is one of those things. Here is the problem: OCAF does not delete labels even if the corresponding object is destroyed. On the long run, you can easily end up having a graveyard of labels that you wouldn't even notice without specific tools like dfbrowse.
 |
Dead labels in OCAF document. They are all allocated from the heap memory but do not contain any attributes, i.e., real data. |
The recent analysis of memory leaks allowed us to improve the data model architecture of Analysis Situs in a couple of ways. First, we now avoid allocating too many OCAF objects whenever possible and prefer using sophisticated attributes (see ticket #170). To confess, that is quite the opposite to my initial design intent with the Active Data framework. The original idea was to exploit standard attributes as much as possible. But, as reality proves, the overheads of such an approach are too big to ignore.
Second, we now try to reuse the labels left by the deleted objects, giving the latter a sort of afterlife. It's like we recultivate the OCAF space and do not allow "dead" labels to be accumulated in the long run (see ticket #171).
Another thing that could easily be misrecognized as a memory leak in OCAF is its undo/redo stack. Keep in mind that whenever you modify an OCAF attribute, it calls its Backup() method internally that is supposed to make a copy (or a delta) for recovering on undo. Make sure to disable transactions to avoid copying stuff whenever you do not need this.
Actually, OCAF is a huge topic in itself. Once you learn how to use it, the whole OCAF business gets quite satisfying. Still, many people prefer implementing their own persistent storage, and we have had quite an interesting conversation on the forum about it. Go ahead and read it if you feel like.
RTFM and fancy C++
False-positive memory leaks could originate from allocators that are supposed to manage memory chunks from preallocated memory arena. We were using RapidJson lib whose allocators might consume quite some bytes and need careful cleanup. The source of memory leak here was the missing virtual destructor in the base class for RapidJson document. As a result, deleting an object through its base-type pointer left the derived objects as garbage in memory. Such a memory leak is hard to spot, but its contribution to the overall process memory was significant.
Another thing is for modern C++ lovers. Here is the code that sucks leaks:
for ( auto aagIt = new asiAlgo_AAGRandomIterator(aag); aagIt->More(); aagIt->Next() )
{
  ...
}
To see the problem here, one should know in advance that this asiAlgo_AAGRandomIterator is designed to be manipulated by OpenCascade's smart pointer. That is no surprise then to see it being allocated from the heap memory, but there's also this auto type definition that messes everything up. The point here is that the compiler has no idea about smart pointers, so it will go and substitute auto with the naked pointer type. Good luck tracing down this memory leak later on, because, yeah, you'll never get your memory back. That is to say that C/C++ has probably become only worse with all these modern whistles that can hide something you unlikely want to be hidden, such as a pointer type.
Conclusion
Hunting down memory leaks is quite a journey unless what you're profiling is a simple independent main() function. After a while, I'm pretty convinced that there's no any magic tool to really help you out in the memory leak detection business. What matters most is your common sense plus care and time. Still, I hope that the information given above would give someone a clue when memory becomes an issue.
Let me wrap it up with a somewhat cliché statement. C/C++ code should be efficient, because these languages are designed for efficiency. It's actually quite a shame to write slow and leaking stuff in those languages, and that is something I've seen a lot. Use your common sense and profile carefully. If you always question the suspicious parts of your code, you will certainly gain better understanding of what's going on. And this single fact will give you a tremendous advantage over those who do not care (read: almost everybody).
Want to discuss this? Jump in to our forum.